I would like to provide population reduction numbers for various birthrates established by various behaviors. The numbers describe the opportunity for the human experiment created by birthrate-driven rapid population decline and I hope make implementing that birthrate a little easier.
I have had to create my own crude model because existing models(1) do not accurately project populations for birthrates below 1.5 births per woman. The model can be downloaded and run (click here.) (2)
The assumptions of the model include.
- starting population 7 billion
- initial age distribution 100 million people at each age.
- everyone dies at age 70
- average age of giving birth 25 (3)
Children per woman is the only independent variable.
The model produces an unconstrained population time history for any number of births per woman down to and including 0. Unconstrained means the model allows all people who are in the 70 age group to die, and assumes there are no other deaths. For example, people do not die from starvation, genocide, illness or accident.(4)
Birthrates above 2 create a family of exponential growth curves. For example, the line in the graph below depicts the world's population from present to 150 years into the future for a constant birthrate of 2.54 births per woman.
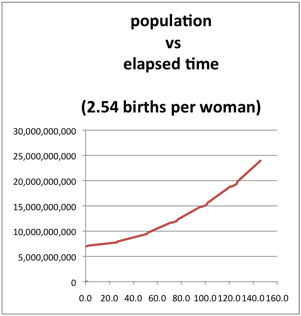
The curve is similar to other models which show a 2060 population of 9-10 billion and a doubling of population this century (not taking into account constraints that may include a die-off.)
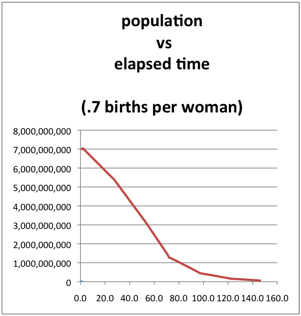
Birthrates below 2 create a family of ~exponential decay curves. One member of this family of curves is the line in the graph below which shows global population for .7 births per woman. Notice that it takes only 46 years to halve the 7 billion population. It takes only 134 years to reduce global population to 100 million.
From each family of curves, those with exponential growth (2 through 7) per woman and those with ~exponential decays (2 through 0) we can make two more curves which show the times needed to double the population to 14 billion or halve the population to 3.5 billion as the number of births per woman ranges from 0 to 7.
In the graph below the doubling times form a line to the right of 2 children per woman on the x axis.
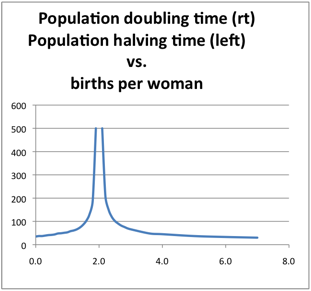
Notice that it only takes 13 years to double a population if women are each having 7 children each. And it takes forever if each woman chooses only 2.
The time durations for 7 billion people decreasing to 3.5 billion (a halving) are collected from each member of the family of curves that show exponential decay. This curve is shown in the above graph for birthrates between 2 and zero children. Notice that the first halving time for .7 births per woman is 46 years.
In the graph below, the time durations to decrease 7 billion population (not to half) but to 100 million are plotted for birthrates 2 through 0.
100 million was chosen because that is what I believe to be the maximum population for human sustainability on our earth if we cap wellbeing at a middle-class American lifestyle.
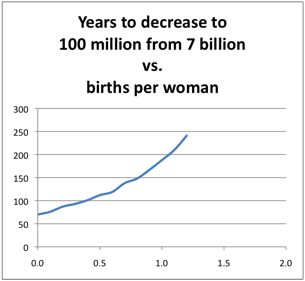
The graph shows that if everyone had no children we could get to a world population of 100 million in 69 years. However more surprising is that at .7 child per woman, that is 7 out of 10 women had one child and the rest had none, it would take only about 134 years to reduce a population of 7 billion to 100 million.
Where did .7 come from? .7 would likely be the net birthrate if a max one child law where to be implemented. Every woman would not have one child. Some women, for infertility reasons, would have none. Some fertile women would be mated with infertile men. Some fertile woman would choose to have none.
.7 births per woman does create very rapid population decline. It would allow today's generation to increase its per capita footprint by 400% during its 70 year lifetime without increasing total human footprint.
After the one child law was in place for 70 years, then each person would be able to increase his/her footprint by 800% during his/her life time and still not cause an increase in total human footprint.---
-------------notes below.----
(1) It is easy to find models that describe a slowing of population growth based on falling birthrates. However, the models that make these projections focus on birthrates dropping from 7 to 2.1 births per woman. They don't make predictions for birthrates that produce rapidly declining population.
There are a few models created for nations that have gone through a demographic transition and have birthrates between 2.1 and 1.5. However, there is a dearth of models that project population trends for birthrates below 1.
I emailed Joel E. Cohen (who is the standing godfather of demography) and he reported back that he had no such model. He sent me to the Population Reference Bureau. They sent me to their consulting UC Berkeley demographer who did not reply. A second inquiry to PRB has gone unanswered. In other words, birth rates below 1 are so far from cultural norms, no demographer would waste his or her time creating such a model.
RPD models that might deal with such a controversial subject as birthrates below 1 are too dangerous for a foundation that relies on culturally conservative contributors. These foundations don't want to be affiliated with research that suggests family planning should implement a maximum of one birth per woman.
(2) My model uses difference equations. The number of people in each age group in a succeeding year is calculated from the previous year. The total population in any year is the sum of people in all 70 age groups. I have used MS Excel as a computational device to create the graphs. Download the MS excel file of model. Need help getting started, please email me Alpert@skil.org
(3) age of mother at birth makes a big difference for rising exponential curves but lesser difference in declining exponential. I tried both 15 and 30 years for the mother's age at giving birth.
(4)The UNFPA curves and my model are different but I don't think the differences change the meaning of the numbers for purposes of showing the effect on population decline for behaviors like "no woman shall bear more than one child."
There are many variables in the real world that are not in my model. For example, my model predicts that a birth rate of 3.6 will produce 80 million more births than deaths. UNFPA suggests we have 80 million more births than deaths today and the average births per woman is 2.54.This might imply that people have rapidly increasing longevity which my model holds constant at 70 years (which is more than the 66 years UNFPA uses.) .
I expect deprivation and genocide to quickly make the death rate exceed the birthrate in the UNFPA models no matter how high birthrates get. That is, I expect a die-off.) But even with the UN's more optimistic deviance from reality I think my graphs help us see the meaning of RPD for our future.
--- continued SKIL note 64)---
